How It Works
A step-by-step guide to building workflows, configuring nodes, and wiring up variables in AutoPilot.
AutoPilot turns data work into a flowchart. You drag blocks — called nodes — onto a canvas, connect them in order, and click Run. Each node does one job and passes its result to the next. It's the visual version of a command-line pipeline:
cat data.csv | filter "age > 30" | sort by "name" > output.csvEverything runs inside your browser tab. Nothing is uploaded, no account is needed, and it keeps working with no internet connection.
100% private
Files never leave your machine.
Works offline
Runs fully in the browser, no server.
Handles huge files
Streams to disk so large data won't crash the tab.
The big idea
A workflow is a left-to-right chain of nodes. The output handle of one node connects to the input handle of the next — "send your result onward." A typical CSV pipeline looks like this:
Bring data in → reshape it → export any node's result straight from the execution panel. Mix and match nodes to build anything from "dedupe this contact list" to "merge ten PDFs and pull out the tables." Browse every available node in the Nodes section of the sidebar.
Create a workflow
- Open Workflows from the sidebar.
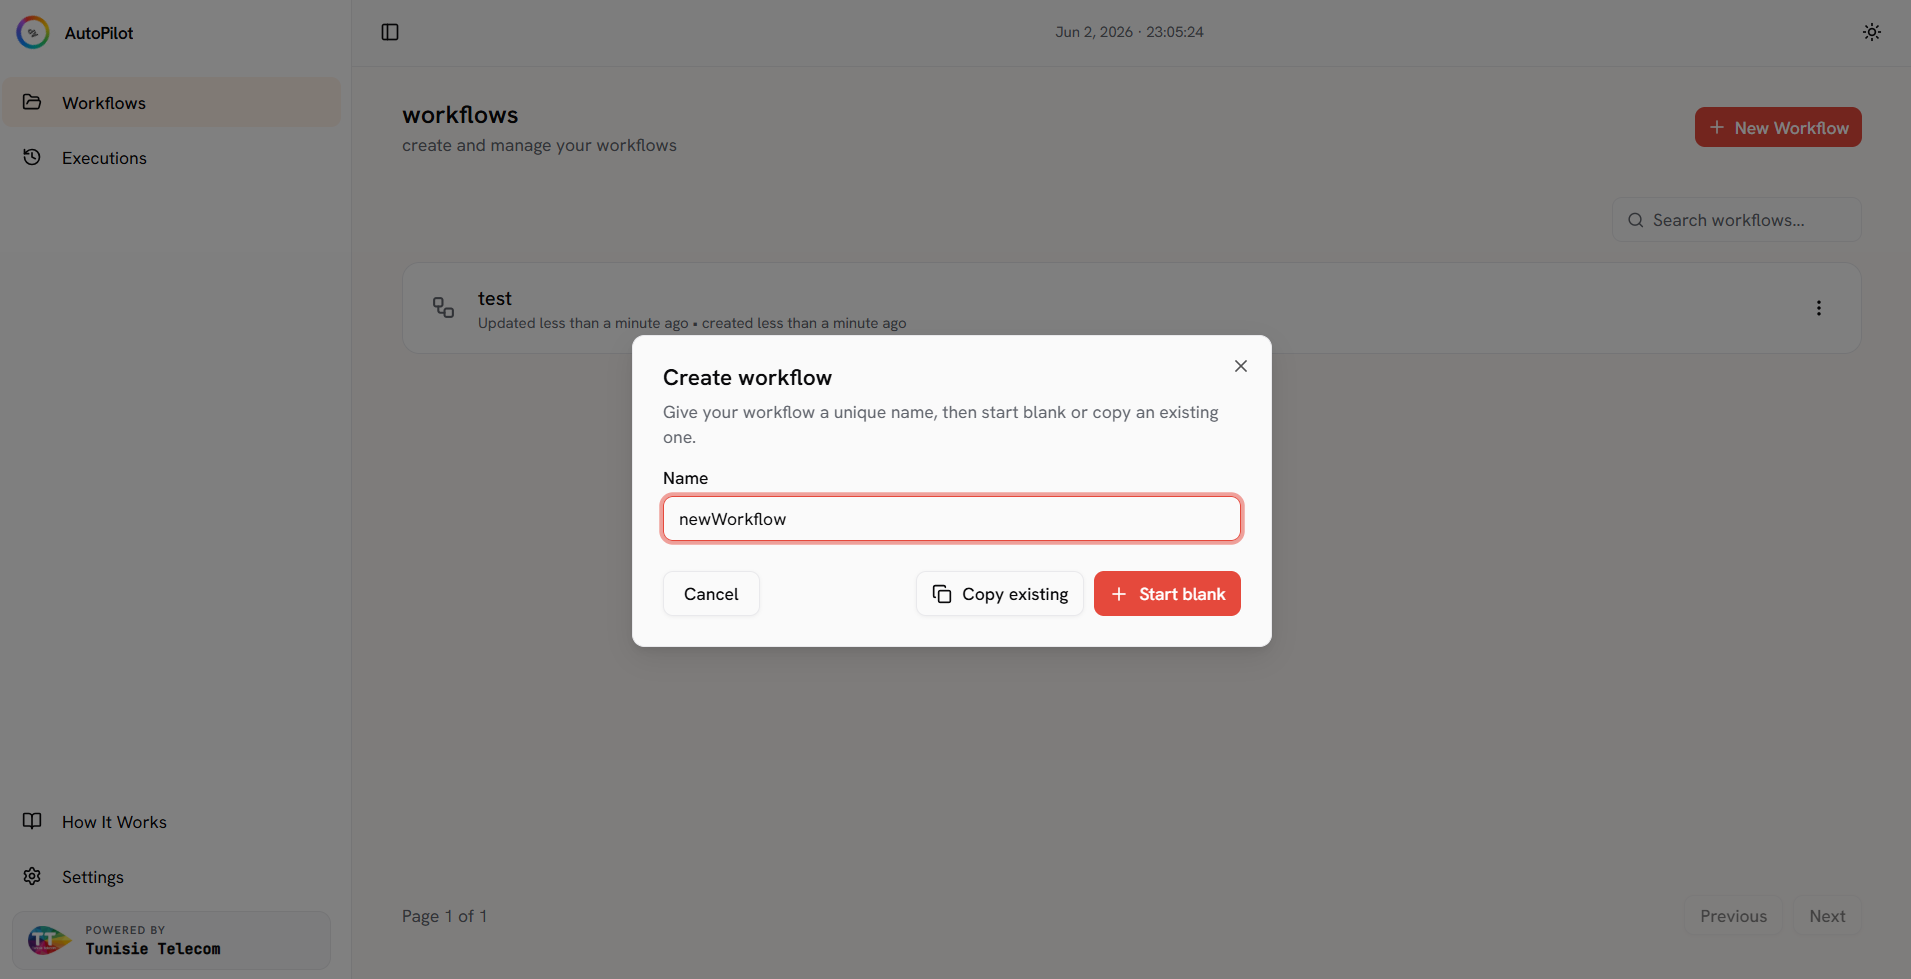
- Click New Workflow. Give it a unique name. If you already have workflows, you'll also see a Copy existing option — pick any workflow to use as a starting point, with its full canvas copied over. Otherwise just click Start blank.
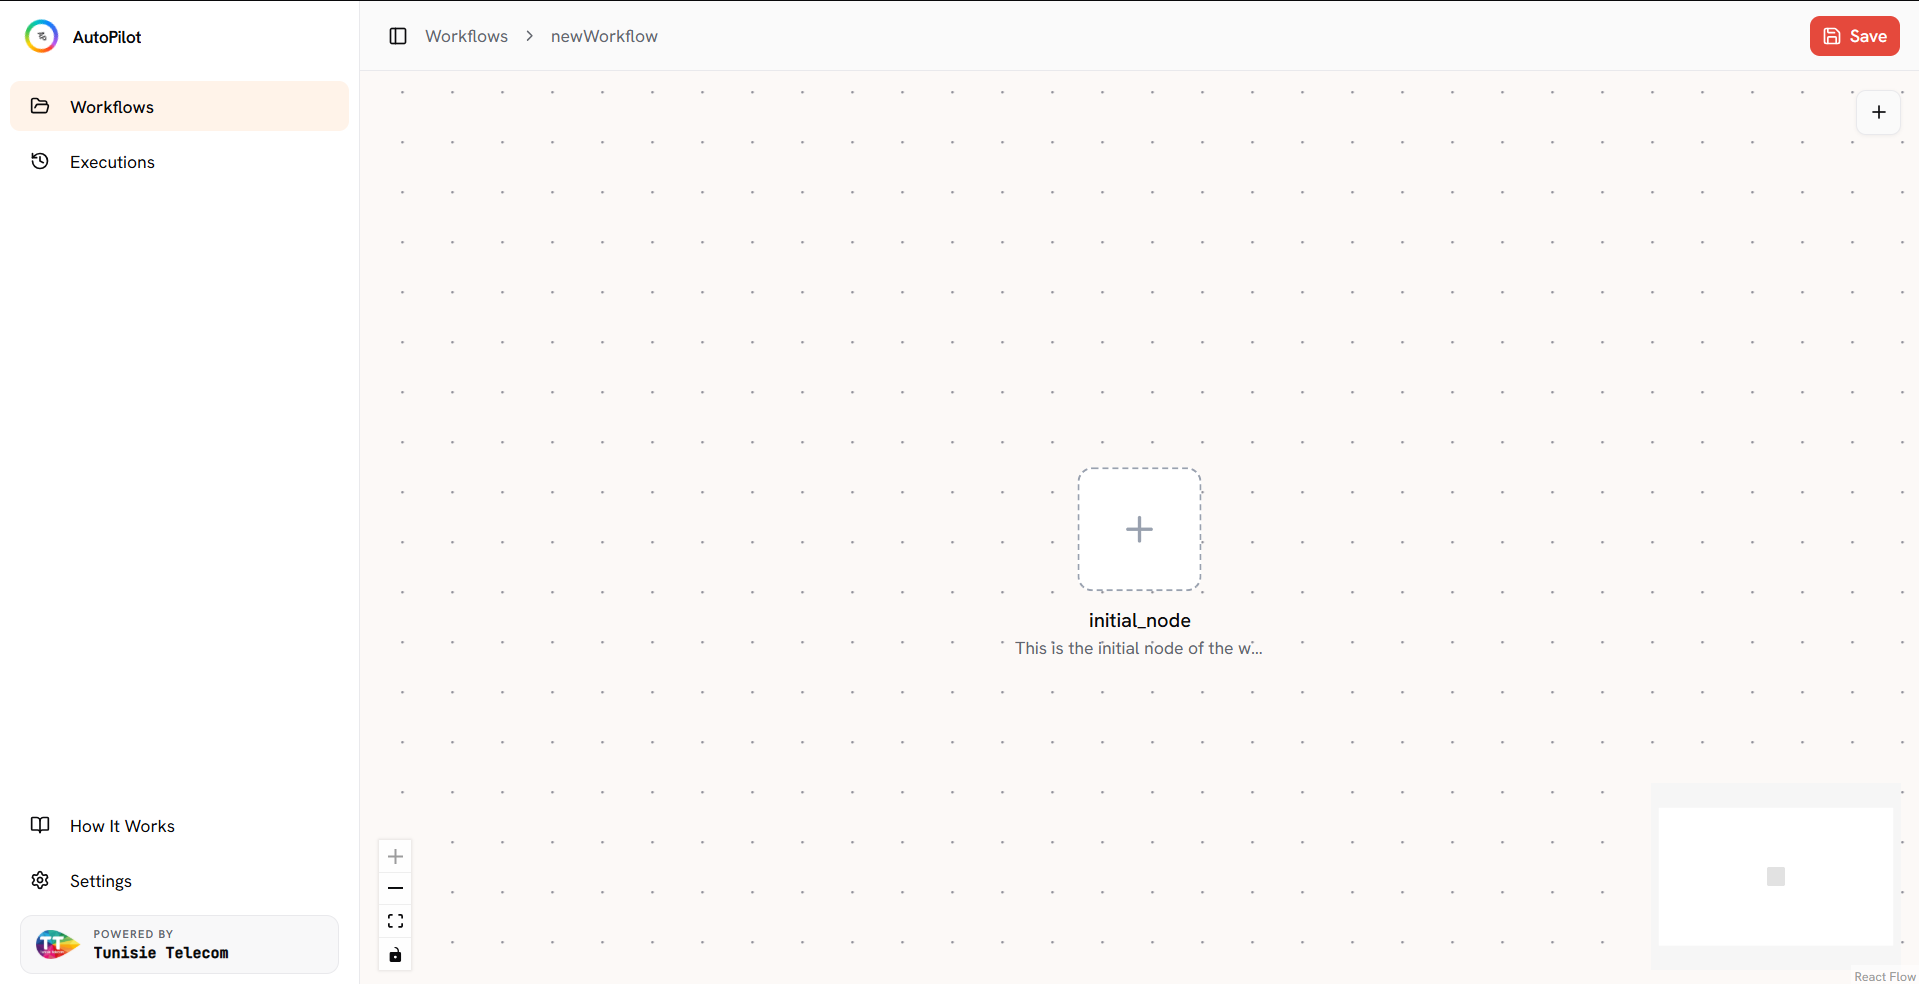
- The canvas opens with a single Start node already placed. Click the tile below it to add your first real block.
- Workflows auto-save to your browser as you build — click Save in the editor toolbar any time to commit changes explicitly.
Add & connect nodes
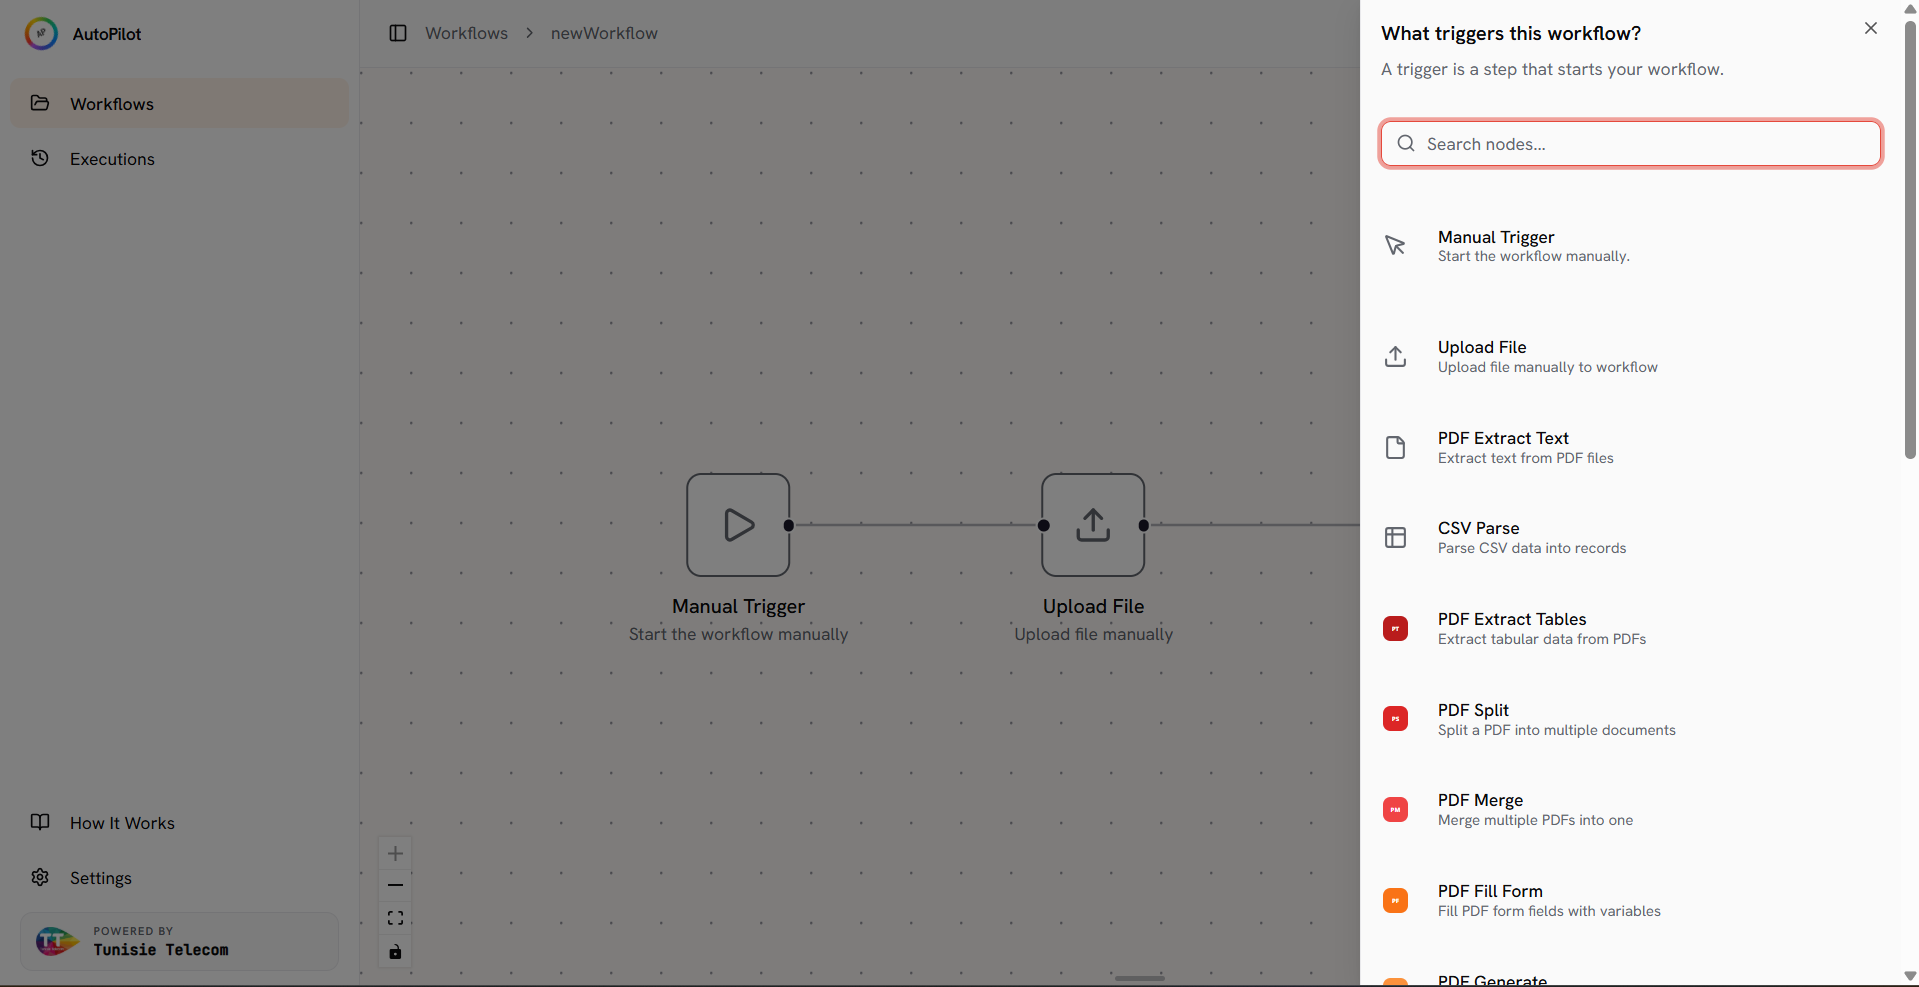
- Click the + button on any node (or the large + tile on the empty canvas) to open the node picker.
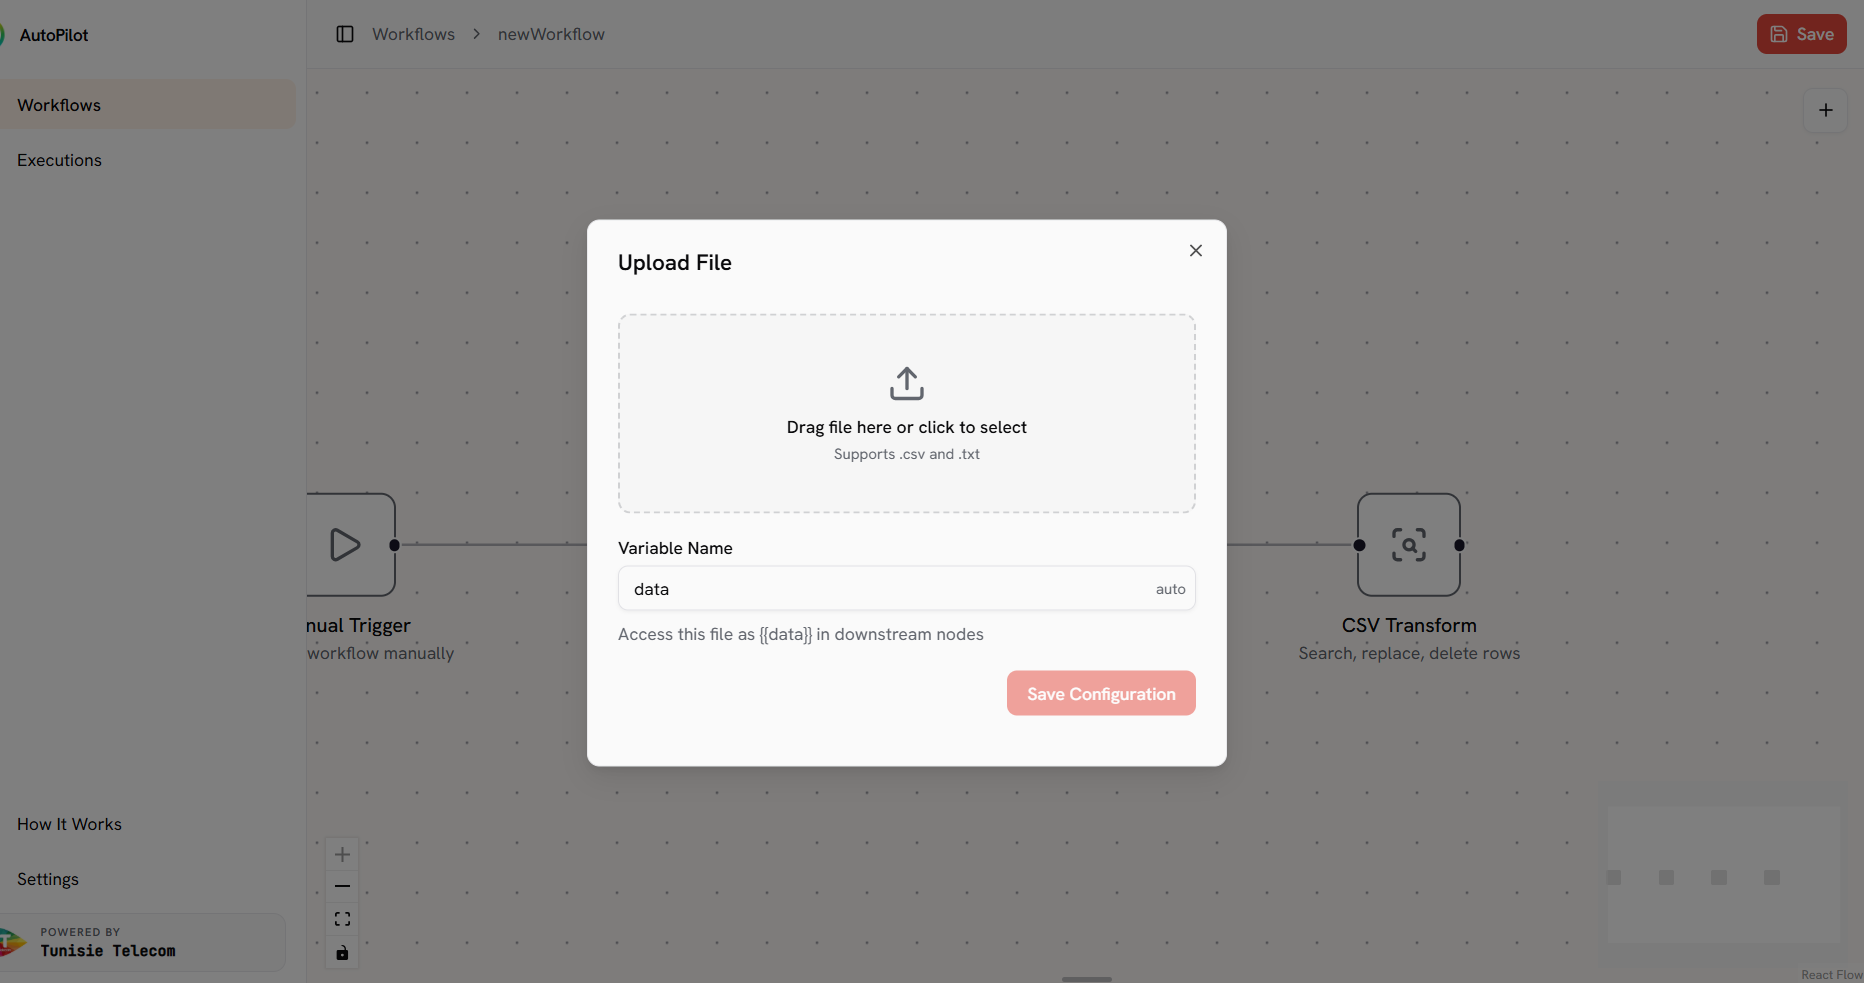
- The very first picker asks "What triggers this workflow?" — pick Manual Trigger (starts when you click Run) or go straight to Upload File.
- Search or scroll the list, then click a node. It drops onto the canvas already wired to the previous one.
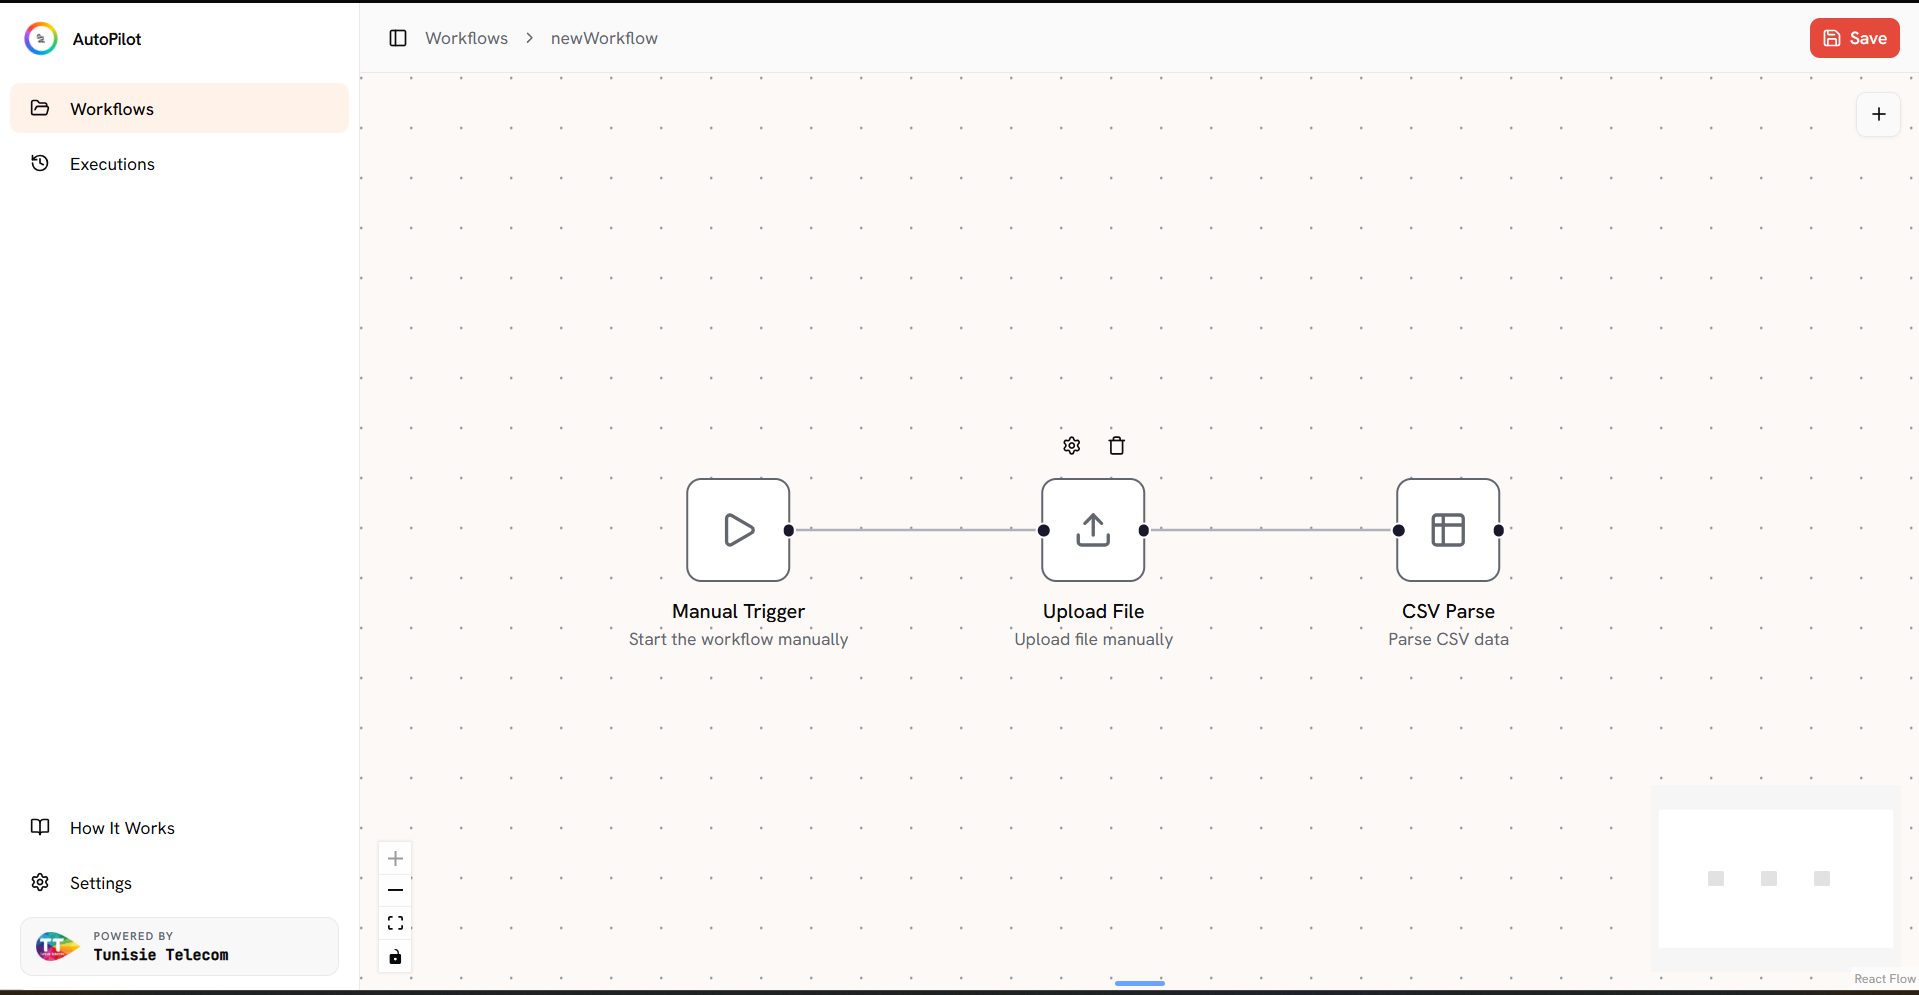
- Connections run handle-to-handle: the dot on a node's right edge (output) connects to the dot on the next node's left edge (input). Drag between handles to rewire manually.
- Each node shows a status indicator after a run — no icon when idle, blue spinner while running, green on success, red on error. Use the gear icon to configure or the trash icon to delete a node.
Configure a node
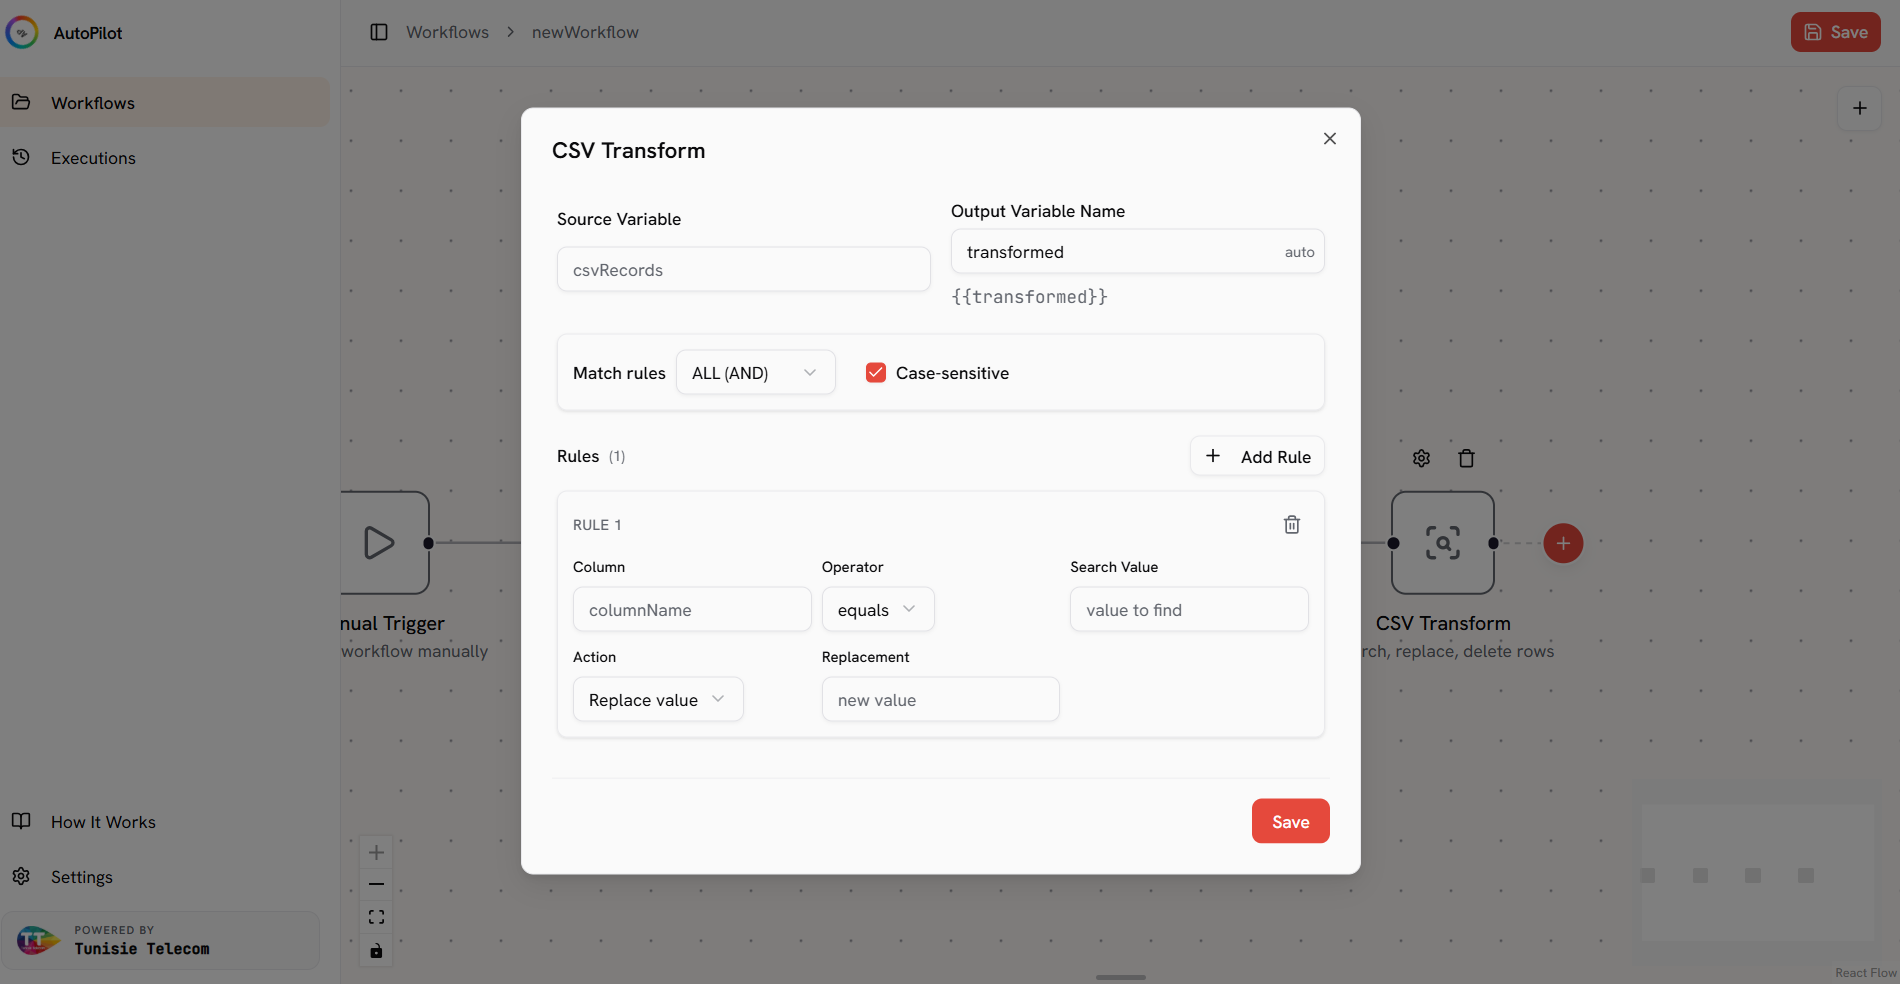
- Click a node's gear to open its configuration dialog.
- Most dialogs share the same three-part structure: an input variable (which upstream result to use), the node options (header, delimiter, sort column, filter conditions, etc.), and an output variable name. Each node's page in the Nodes section documents its exact fields.
- Fields are validated with Zod. If something required is missing you'll see an inline message and the Save Configuration button stays disabled until the form is valid.
- Click Save Configuration — settings are persisted automatically in your browser's IndexedDB.
Variables
Variables are how data travels between nodes. Every node that produces data writes its result to a named variable. The next node picks that name from a dropdown as its input. Think of it as a shared bag of results that grows as the workflow runs.
- When you configure Upload File, you give the file a name like
data. Downstream nodes can reference it by selectingdatain their input-variable dropdown. - CSV Parse reads
dataand writes a new variable, e.g.parsedData. - CSV Filter reads
parsedDataand writesfilteredData, and so on down the chain. - The output variable name is suggested automatically — when you open the dialog you'll see an auto badge next to the field, showing the suggested name. Simply leave it or type over it to rename.
- Column fields (those asking for a header name) autocomplete from the upstream file's schema — once a file is parsed you'll see the real column names as suggestions.
cleanContacts, over30) rather than the node type. When a workflow has ten nodes, descriptive names make the input dropdowns far easier to read.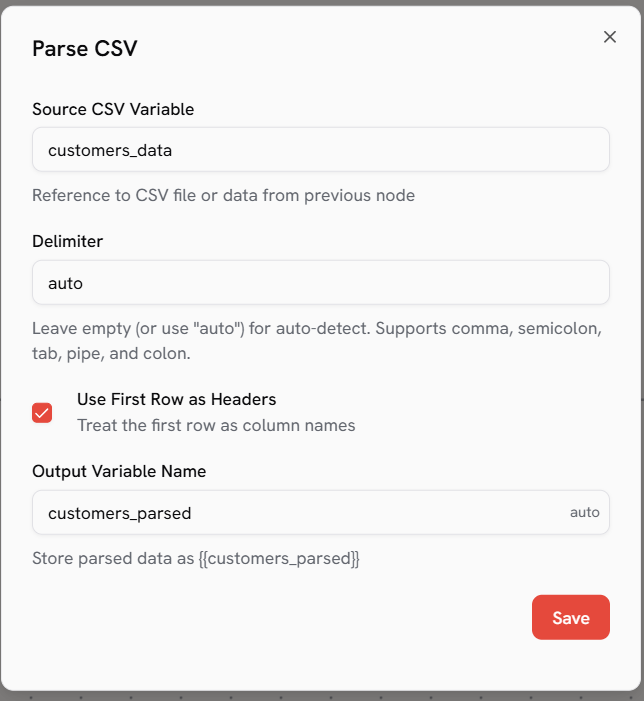
Run & read results
- Click Run in the editor toolbar. AutoPilot calculates the correct execution order automatically (topological sort) and runs each node in sequence.
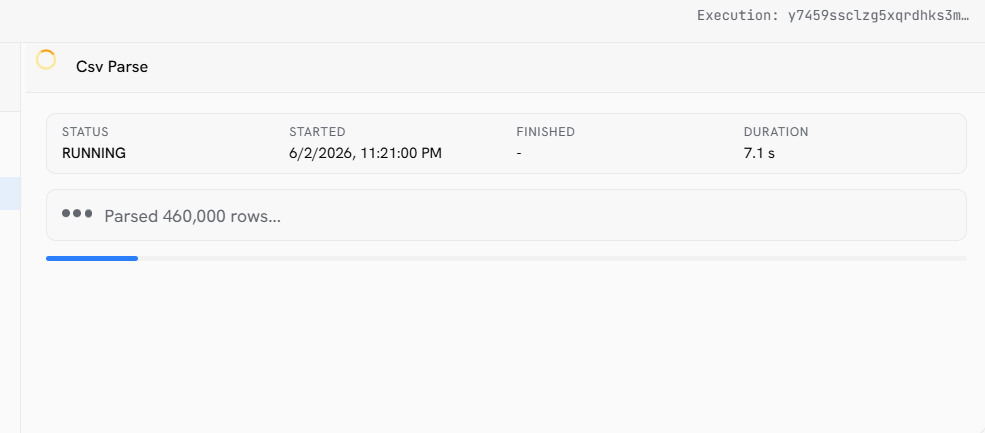
- A progress panel opens on the right. Node indicators turn blue while running and green when done; large files show a live progress bar.
- If a node fails it turns red with an error message, and the run stops there so you can fix the configuration and re-run.
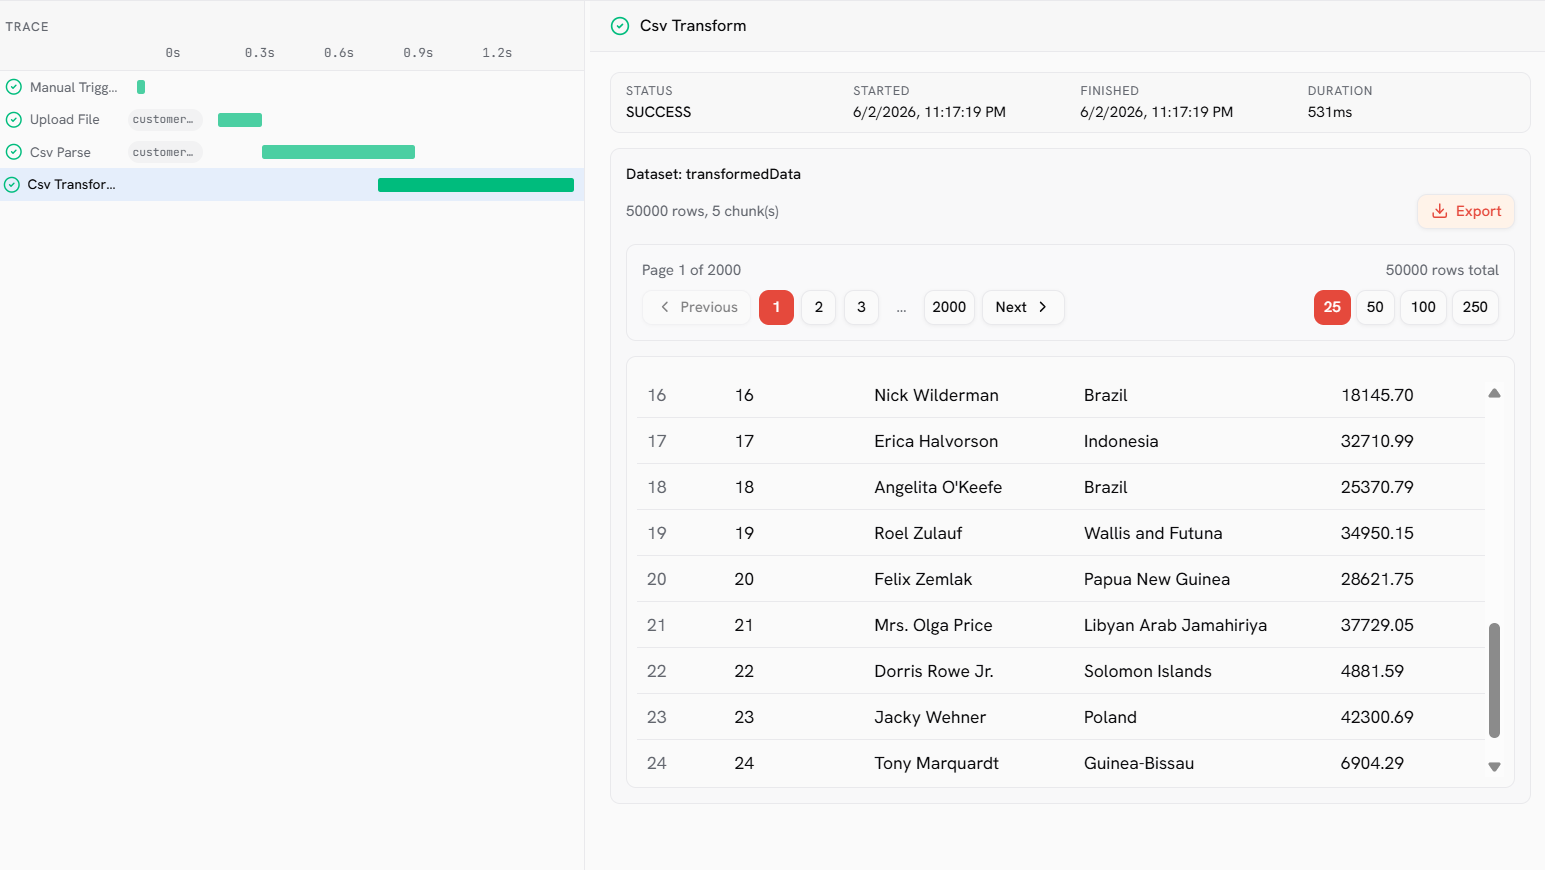
- When the run finishes, open the execution panel and click any node's output row to preview it. Hit Export to download the data as CSV, Excel (.xlsx), TXT, or PDF. Toggle "Download in segments" to split very large results into multiple files.
- Every run is saved under Executions in the sidebar — open any past run to see per-node timing, a paginated dataset preview, and to re-download results at any time.
Worked example
Filter a contact list down to people over 30 and export it. Three nodes, end to end.
Upload File
- Drop in
- your contacts.csv file
- Output variable
- data
CSV Parse
- Input variable
- data
- Has header
- on
- Delimiter
- auto-detect
- Output variable
- parsedData
CSV Filter
- Input variable
- parsedData
- Condition
- age > 30
- Logic
- AND
- Output variable
- filteredData
filteredData from the execution panel — pick CSV or Excel and optionally split into segments.Build your first workflow
It takes about a minute. Add a trigger, drop in a file, chain a couple of nodes, and hit Run.
Storage
AutoPilot keeps everything on your own machine — nothing is uploaded to a server. Two browser technologies work together, with an optional folder on your disk for long-term keeping.
IndexedDB — the metadata store. Your workflows, nodes, edges, run history, dataset manifests (schema and row counts) and caches live in IndexedDB, the browser's built-in database (accessed through Dexie). It survives refreshes and works offline.
OPFS (Origin Private File System) — the row store. The actual rows of every dataset are written as chunked JSON files in OPFS, a private per-origin file system. It is much faster than IndexedDB for large files and no other website can read it.
Folder archiving (Chromium only). On Chrome, Edge and other Chromium browsers you can link a workflow to a real folder on your computer. Completed runs are archived there automatically; once archived, the browser copy is reclaimed — the folder becomes the durable home and the browser is just a working cache.
Settings → Storage shows your browser storage quota, whether storage is 'persistent' (protected from automatic eviction), and counts of workflows, executions and datasets. It also has cleanup tools: remove orphaned OPFS fragments left by interrupted runs, or clear all in-browser execution data (folder-archived runs are kept).
Performance
AutoPilot processes files in chunks so even multi-gigabyte datasets never load into RAM all at once. A single setting controls the chunk size.
Chunk size is the number of rows held in memory per OPFS chunk file. Bigger chunks mean fewer files and faster sequential I/O but more RAM per operation; smaller chunks are gentler on low-memory machines.
| Preset | Chunk size | Recommended RAM |
|---|---|---|
| Balanced | 10,000 rows | 4 GB+ |
| Performance | 25,000 rows | 8 GB+ |
| Maximum | 50,000 rows | 16 GB+ |
Prefer a custom value? Any number between 5,000 and 100,000 rows works. The setting is saved in your browser (localStorage).
Heavy operations — sort, join, aggregate, compare — use streaming algorithms (external merge sort, grace hash join, streaming accumulators) that respect the chunk size, so they scale beyond available memory.
Open Settings → Performance to pick a preset or drag the slider. If a large run feels slow or the tab is under memory pressure, step the chunk size down.
Add AI
AI is optional. One setting (Settings → AI) powers both the in-editor Assistant and the AI Text node — a local model via Ollama (private, offline, no API key) or any OpenAI-compatible remote API (stronger, but sends your prompts to that provider).
- 1Install Ollama from ollama.com (or point AutoPilot at any reachable Ollama endpoint).
- 2Pull a model — for example run the command below in a terminal.
- 3Running AutoPilot from localhost already shares an origin with Ollama — no CORS step needed here.
- 4In Settings → AI, set the endpoint (default http://localhost:11434), pick your model, and click Test connection.
- 5Add an AI Text node, connect a dataset, chart or text input, and write a prompt.
Pull a model
ollama pull gemma3:4bPrefer a remote model? In Settings → AI, switch the provider to "Remote (OpenAI-compatible)", set the base URL and model, and paste your API key — it's kept in memory for this session only and is never written to disk.
AI Text calls the model once per run and always re-runs it on every execution — there's no caching. Everything else in AutoPilot stays fully offline; AI only activates while your configured endpoint is reachable.